Axe des QRS (ou axe électrique du cœur) dirigé dans le plan frontal en haut à gauche au delà -30°. Il est le plus souvent pathologique. Un axe gauche, lorsqu’il est confirmé, doit faire rechercher une pathologie qui amplifie la dépolarisation latérale du ventricule gauche.
Rappel : l’axe du cœur habituel est compris entre +90 et -30° (cf. Axe du cœur).
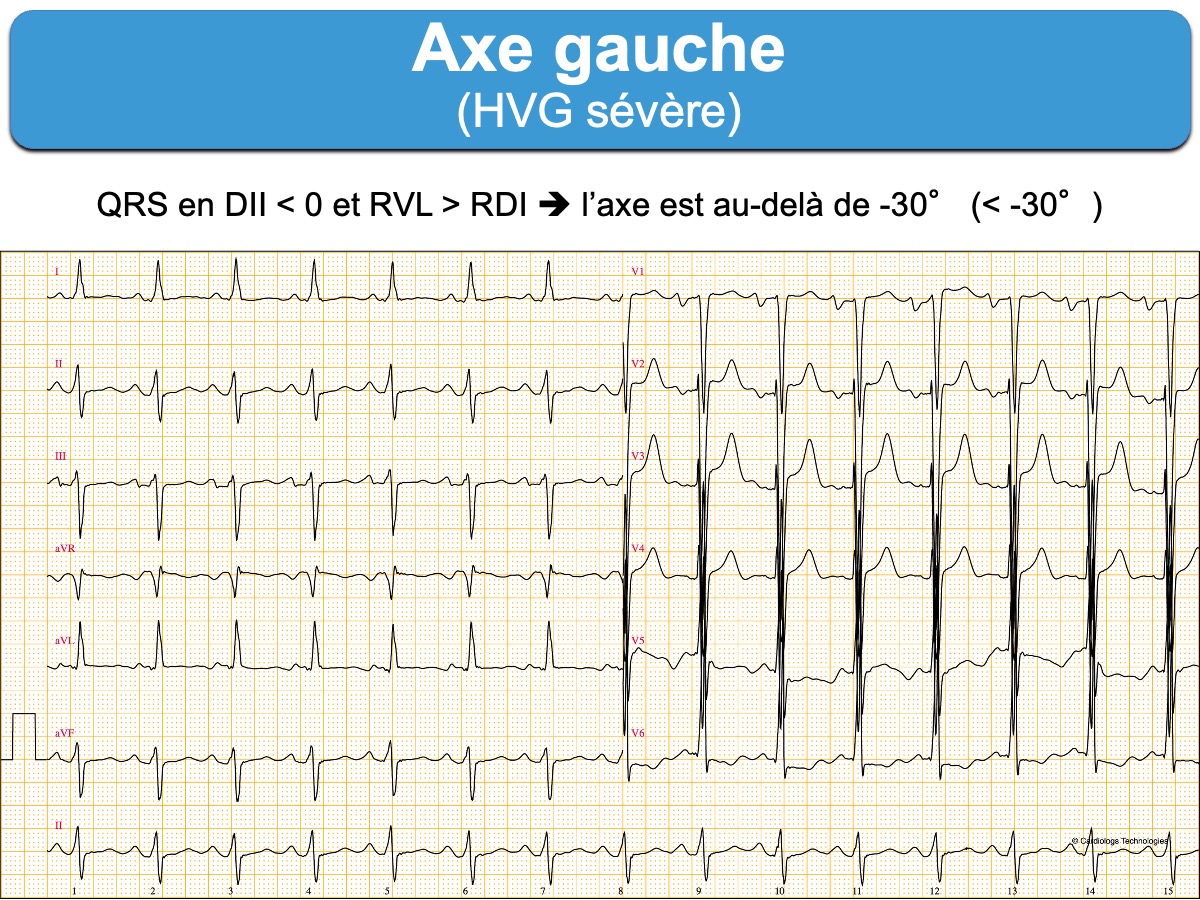
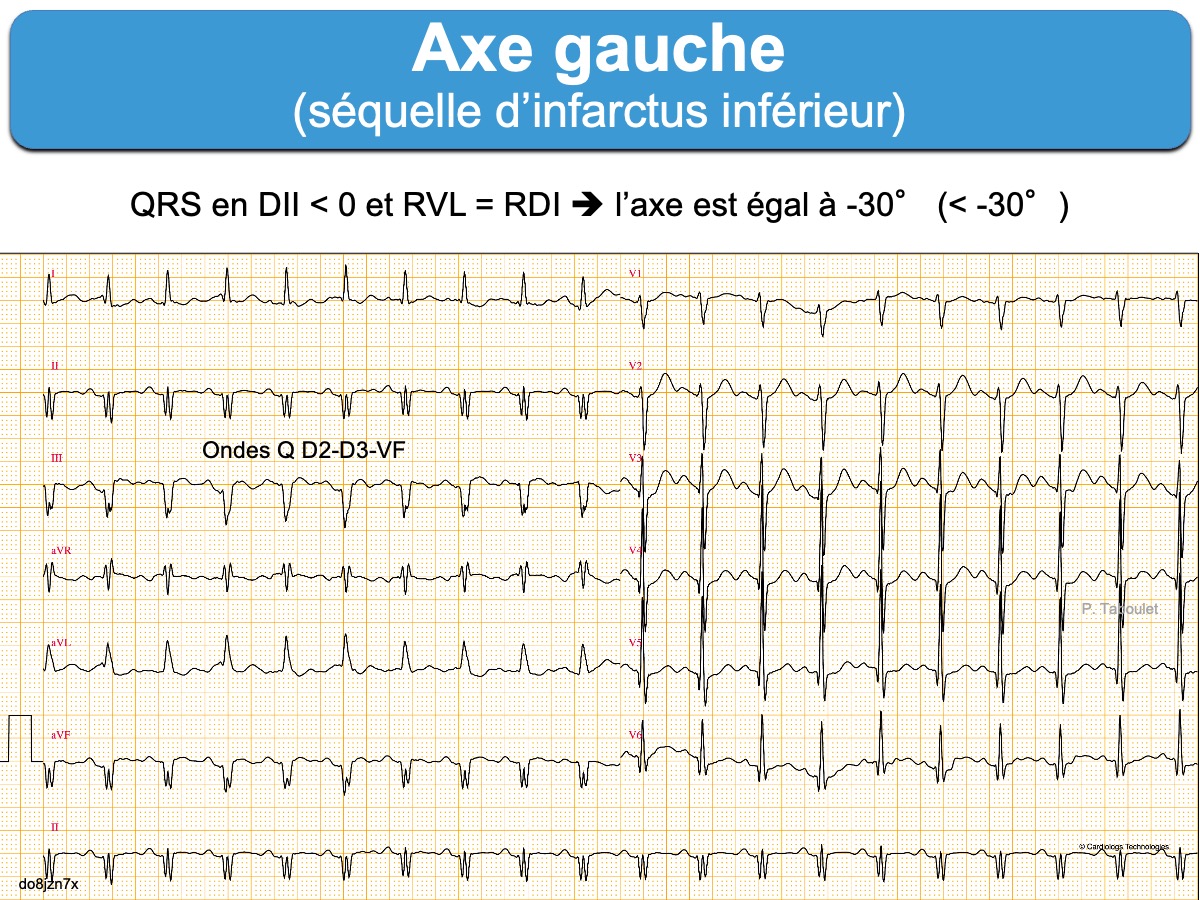
Axe gauche
Axe des QRS entre -30° et -45° (QRS négatifs en DII avec R < S, positifs en DI-VL avec R VL comparables à R DI) [1].
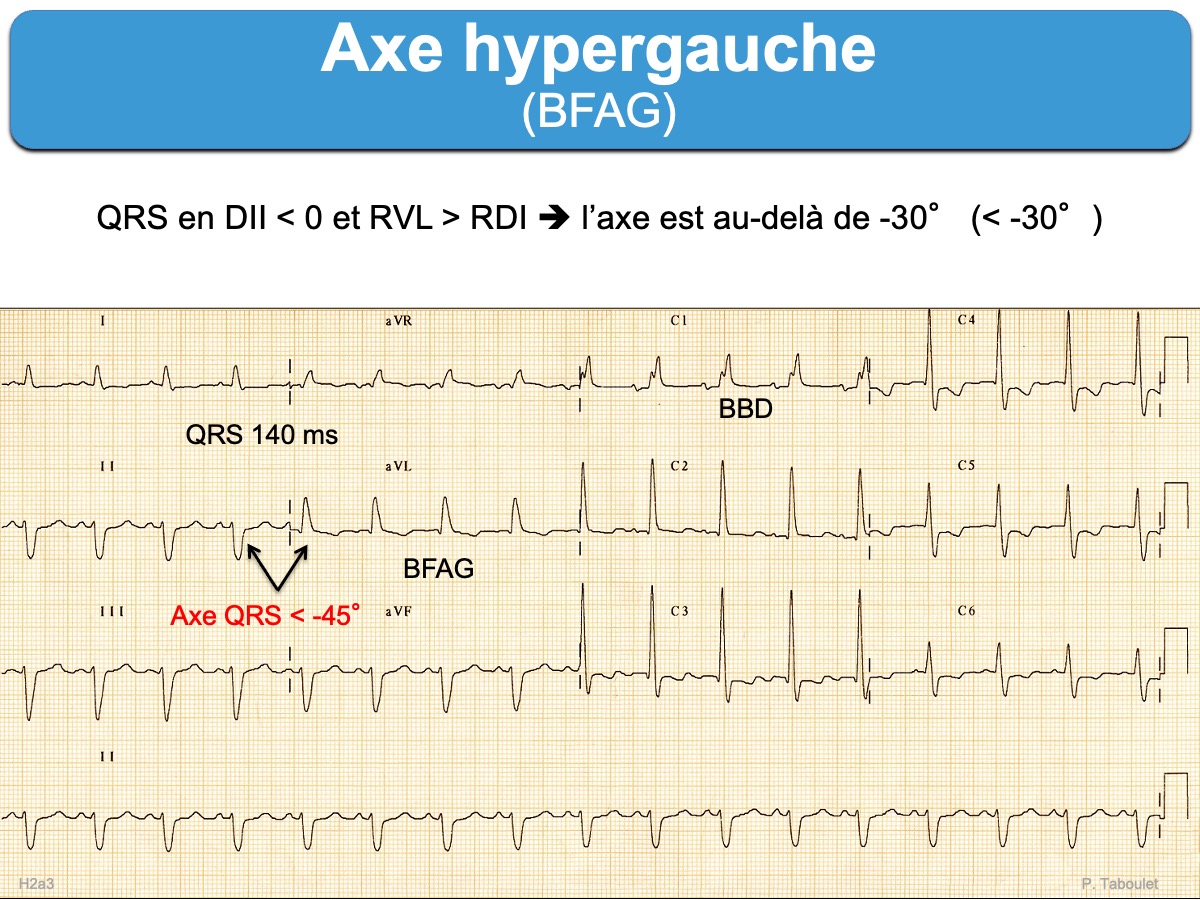
Axe hypergauche
Axe des QRS < -45° (QRS négatifs en DII avec R < S, QRS positifs en DI-VL avec R VL > R DI) [1].
Étiologies des axes gauches ou hypergauches
- Un axe gauche est physiologique chez certaines personnes (sujet bréviligne ou âgé)
- Un axe entre 0° et -40° se rencontre au cours de l’hypertrophie ventriculaire gauche (cf. HTA, valvulopathie aortique, cardiomyopathie du VG).
- Sinon, un axe gauche doit faire rechercher un bloc fasciculaire antérieur gauche au-delà de -45°, une préexcitation ou une séquelle d’infarctus dans le territoire inférieur.
Un axe gauche, tout comme un axe droit, est un prédicteur significatif de la mortalité toutes causes confondues sur 10 ans et peut servir d’outil utile pour la stratification du risque de mortalité à long terme [2].
[1] Surawicz B, Childers R, Deal BJ, et al. AHA/ACCF/HRS recommendations for the standardization and interpretation of the electrocardiogram: part III: intraventricular conduction disturbances: a scientific statement from the American Heart Association Electrocardiography and Arrhythmias Committee, Council on Clinical Cardiology; the American College of Cardiology Foundation; and the Heart Rhythm Society: endorsed by the International Society for Computerized Electrocardiology. Circulation. 2009;119(10):e235–e240. The mean frontal plane electrical axis, determined by the vector of the maximal (dominant) QRS deflection, depends on age and body habitus…. In adults, the normal QRS axis is considered to be within -30°and 90°. Left-axis deviation is -30°and beyond. Moderate left-axis deviation is between -30°and -45°. Markedleft-axis deviation is from -45° and -90° and is often associated with left anterior fascicular block.
[2] Bradshaw S, Movahed MR. Left and right axis deviation on ECG as predictors of long-term mortality. J Electrocardiol. 2025 Sep-Oct;92:154064.
The dataset was originally compiled for a separate study on the prevalence of certain ECG abnormalities and included ECGs described as “randomly selected” from both inpatient and outpatient encounters, although the exact sampling process and inclusion criteria were not documented
Most ECGs showed a normal axis (90.3 %), while 6.7 % had LAD and 3.0 % had RAD. Ten-year mortality was significantly higher in patients with LAD (65.1 %) and RAD (48.7 %) compared to those with a normal axis (28.4 %) (log-rank p < 0.001).